End to End Analysis Example
This page will guide you through an end-to-end analysis use case with Hubble and Google Looker Studio
Prerequisites
- Make sure you have connected to Hubble by following the instructions in the Connecting page
- You have access to Google Looker Studio
- You have read and understand the general Best Practices for querying BigQuery data
Create a Dashboard Analyzing Soroban Metrics
Attach Data Sources to Looker Studio
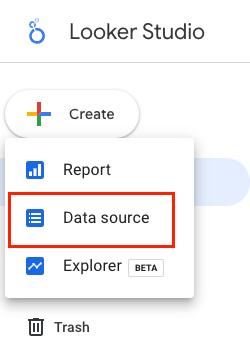
- Select
Create --> Data source
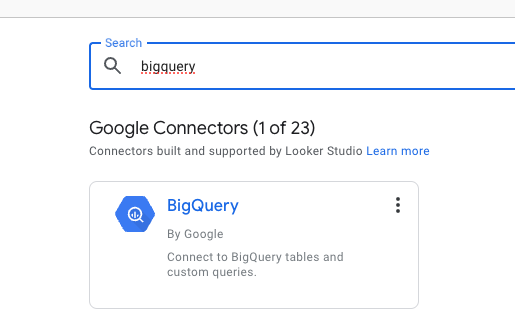
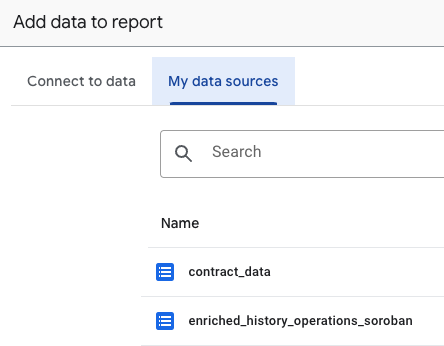
- Find and select the
BigQuery Google Connector
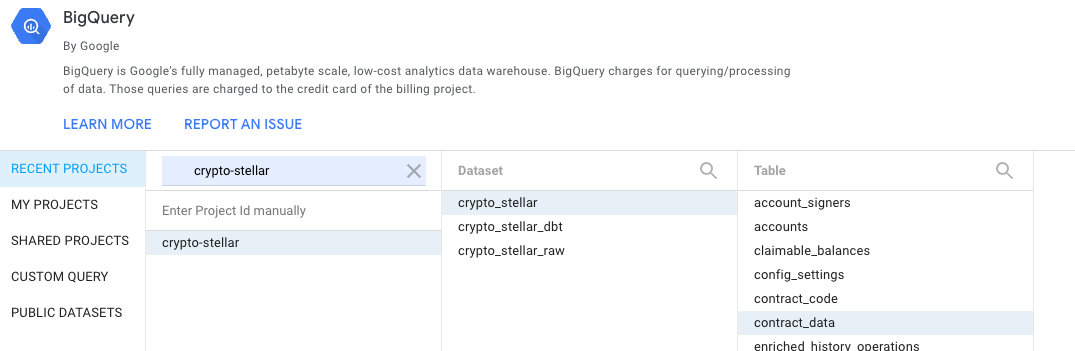
- Find the desired tables that you want to connect. For this example you will want to add a data source for:
crypto-stellar.crypto_stellar.contract_data
Create a New Report (Dashboard)
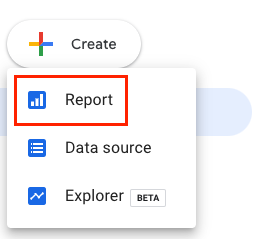
- Select
Create --> Report
- Add your data sources from above
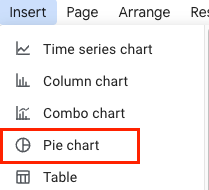
- Insert a
Pie chart
- Choose
contract_dataas theData source
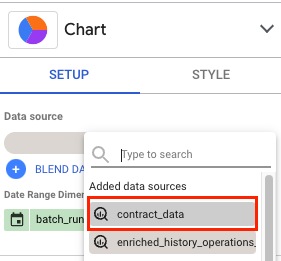
- Choose
closed_atas theDate Range Dimensionandcontract_durabilityas theDimension
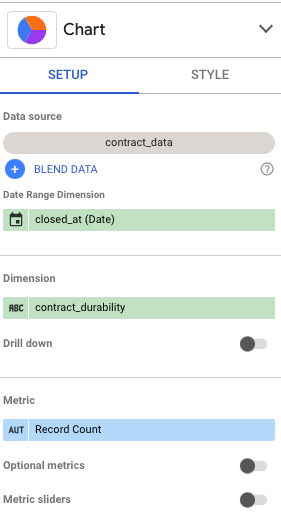
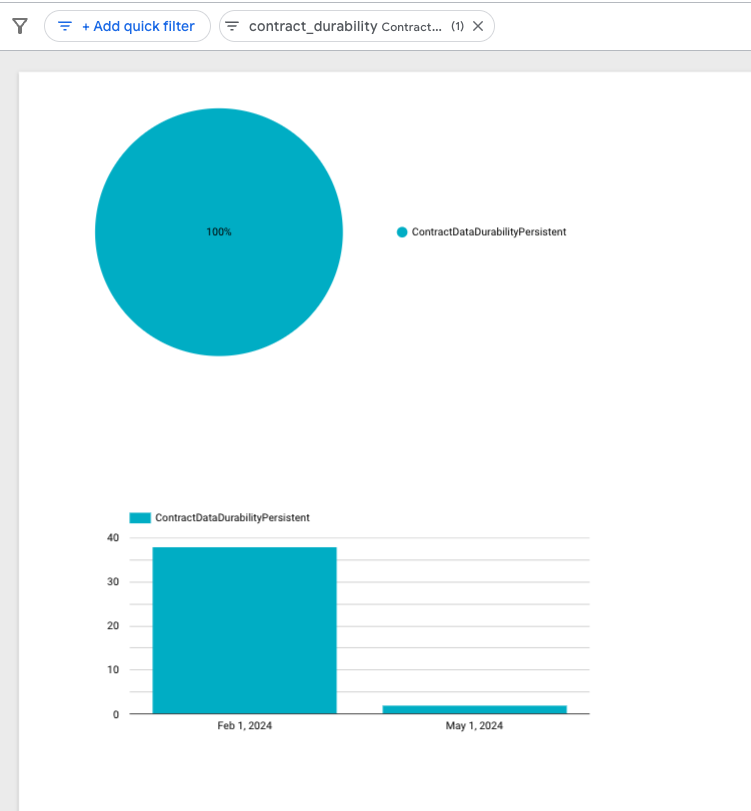
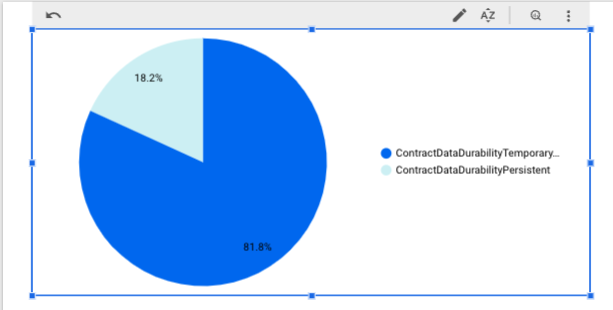
- You should now have a pie chart showing the percentage of Temporary VS Persistent Contract Data Durability
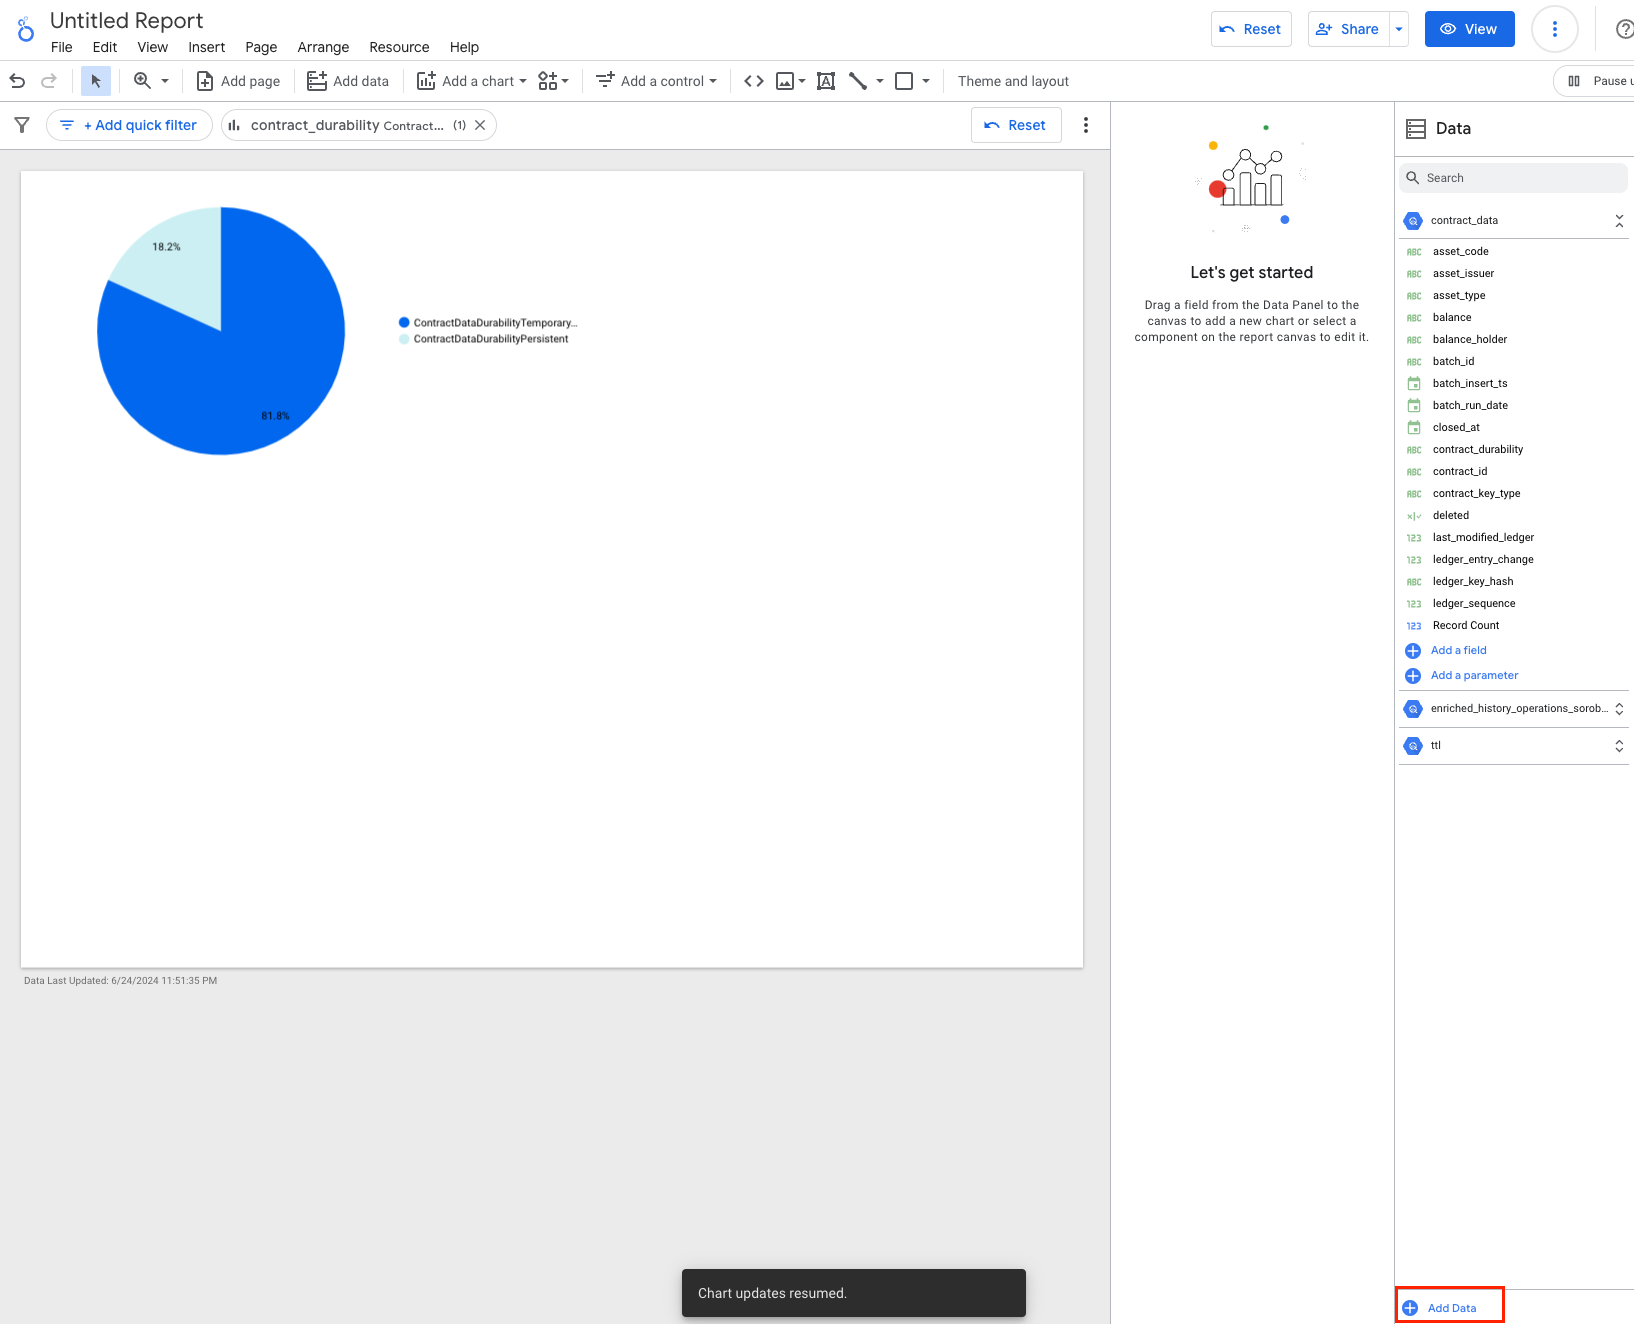
Use Custom SQL to Create a Chart
- In your report, click
Add Datawhich will be near the bottom right of your window
- Select
BigQueryand chooseCUSTOM QUERYand select your desiredBilling Projectwhere the query will be charged
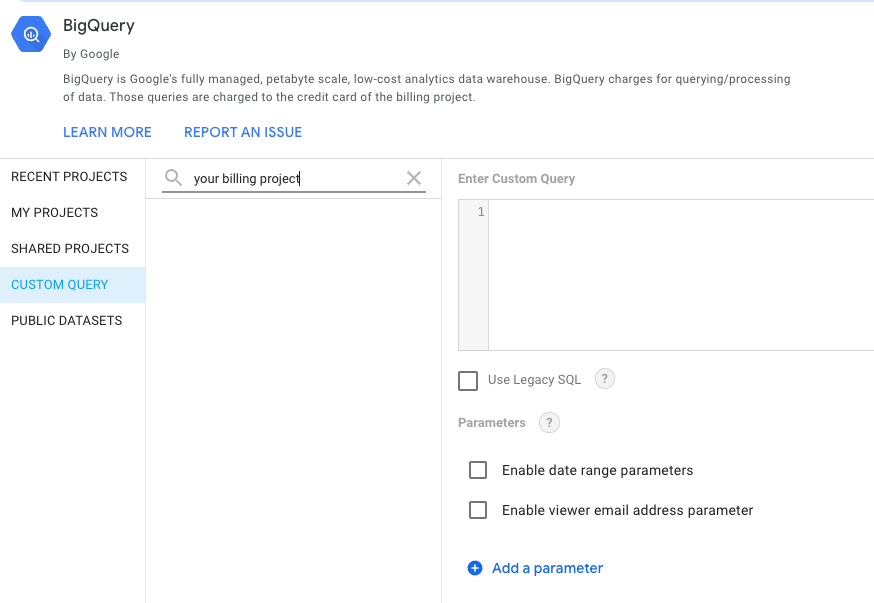
- Add the following query and click
Add
-- Find the latest ledger sequence within Hubble.
-- This may be slightly behind the actual Stellar latest ledger
-- because Hubble is scheduled to run and insert data at 5 minute intervals
with latest_ledger_in_hubble as (
  select
    max(sequence) as latest_ledger_sequence
  from `crypto-stellar.crypto_stellar.history_ledgers`
),

-- Find all the ttl that have expired
expired_ttl as (
  select
    key_hash
    , live_until_ledger_seq
    -- Saving the date to aggregate on at the final step of the query
    , date(closed_at) as ledger_date
  from `crypto-stellar.crypto_stellar_dbt.ttl_current`
  where true
    -- Filter for expired entries only with the use of latest_ledger_sequence
    and live_until_ledger_seq < (select latest_ledger_sequence from latest_ledger_in_hubble)
)

-- Aggregate based on the month and contract durability type
select
  date_trunc(et.ledger_date, month) as month_agg
  , cd.contract_durability
  , count(1) as expired_entry_count
from expired_ttl as et
  join `crypto-stellar.crypto_stellar_dbt.contract_data_current` as cd
    on et.key_hash = cd.ledger_key_hash
where true
  -- Optionally filter for a specific date/date range
  and et.ledger_date between '2024-02-01' and '2024-06-30'
group by 1,2
order by 1 desc, 2
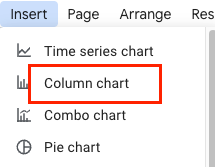
- Insert
Column chart
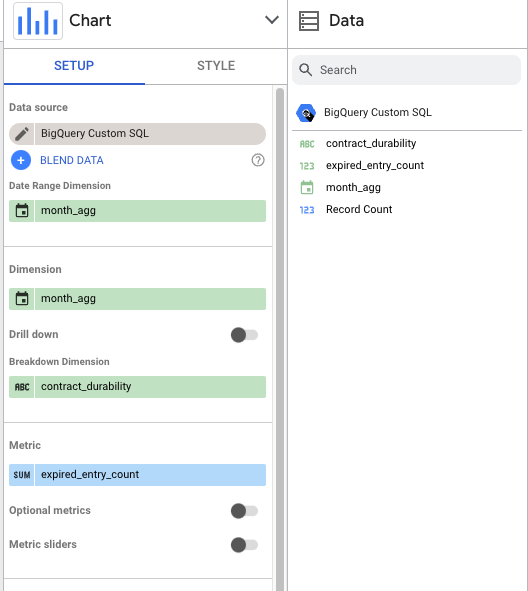
- Select
BigQuery Custom SQLas yourData source,month_aggas theDimension,contract_durabilityas theBreakdown Dimension, andexpired_entry_countas theMetric`
- You should now have a column chart (bar chart) showing the expired Soroban contract entries
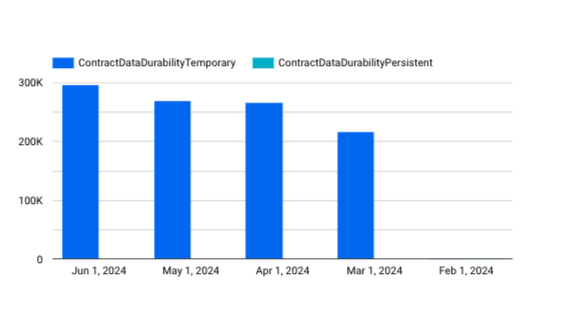
note
Note that between 2024-02-01 and 2024-06-30 there aren't that many expired persistent entries
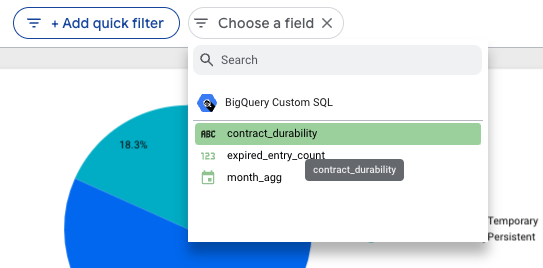
- Click
+Add quick filterto apply a filter throughout the whole report

- Select
contract_durabilityto filter bycontract_durabilityvalues
- Select only
ContractDataDurabilityPersistentand clickApply
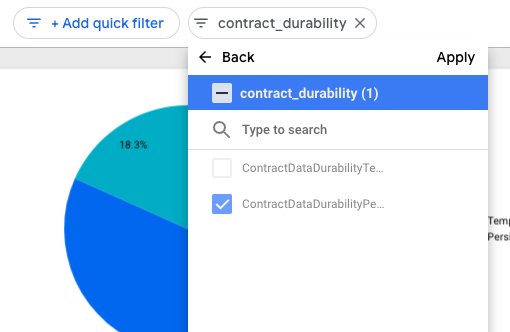
- Your charts should now be filtered and show only
ContractDataDurabilityPersistentdata